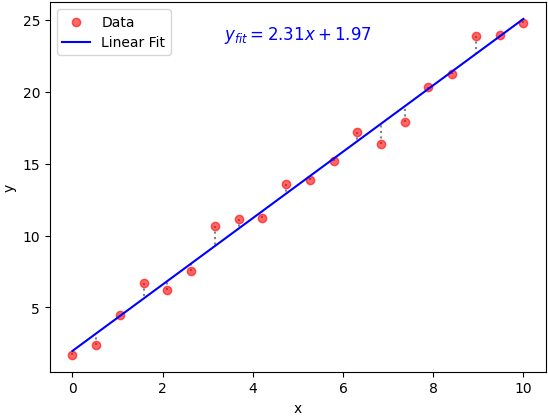
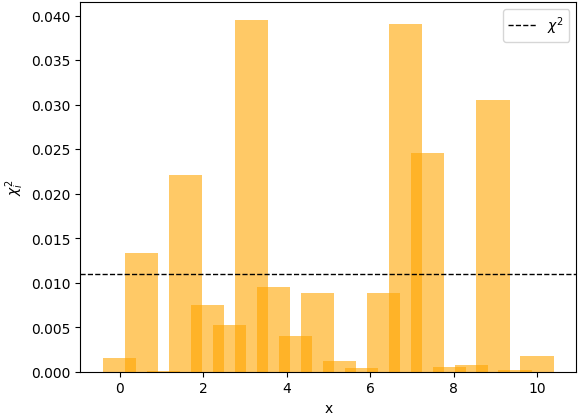
Difference between observed and predicted values


Curve fitting requirements
- Estimate parameter uncertainties
- Support non-linear problem solving
- Easily change optimization algorithm
- Provide high-level tools for setting parameter bounds
Recommended tool (by me)
| Topic | Details |
|---|---|
| Library Name | lmfit |
| Description | High-level interface to non-linear optimization and curve fitting problems |
| GitHub Stars |  1.1k 1.1k |
| Last Commit Date | 13.10.2024 (on 22.10.2024) |
| Built On | SciPy’s curve_fit |
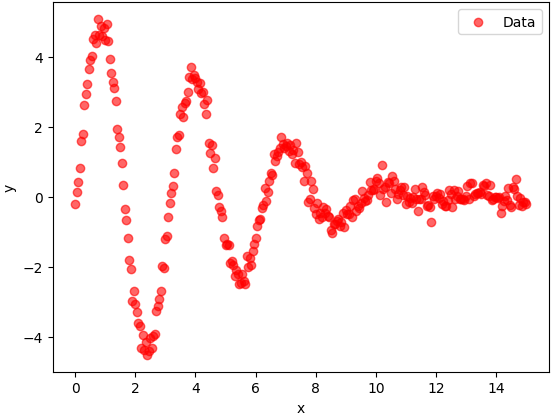
A new non-linear problem
 |
 Let's see some code
 Let's see some code
Problem setup
from lmfit import Minimizer, create_params

def residual(parameters, x, data):
    model = (
        parameters["amplitude"]
        * np.sin(x * parameters["omega"] + parameters["phi"])
        * np.exp(-x * x * parameters["gamma"])
    )
    return model - data

parameters_initial = create_params(
    amplitude=10,
    gamma=0.1,
    omega=3.0,
    phi=0.0,
)

minimizer = Minimizer(residual, parameters_initial, fcn_args=(x, data))
result = minimizer.minimize(method="least_squares")
Handling bounds
from lmfit import Parameters

params = Parameters()
params.add('amplitude', value=10, min=0)
params.add('gamma', value=0.1)
params.add('phi', value=0.0, min=-np.pi/2., max=np.pi/2.)
params.add('omega', value=3.0)
from lmfit import create_params

params = create_params(amplitude=dict(value=10, min=0),
                       gamma=0.1,
                       omega=3,
                       phi=dict(value=0, min=-np.pi/2, max=np.pi/2))
Interpret simulation results
[[Fit Statistics]]
    # fitting method   = least_squares
    # function evals   = 58
    # data points      = 301
    # variables        = 4
    chi-square         = 12.1867036
    reduced chi-square = 0.04103267
    Akaike info crit   = -957.236198
    Bayesian info crit = -942.407756
[[Variables]]
    amplitude:    5.03088066 +/- 0.04005821 (0.80%) (init = 10)
    gamma:  0.02495457 +/- 4.5396e-04 (1.82%) (init = 0.1)
    omega:  2.00026311 +/- 0.00326183 (0.16%) (init = 3)
    phi: -0.10264955 +/- 0.01022294 (9.96%) (init = 0)
[[Correlations]] (unreported correlations are < 0.100)
    C(omega, phi) = -0.7852
    C(amplitude, gamma)   = +0.5840
    C(amplitude, phi)   = -0.1179

 +
+  +
+  =
= 
